Writing a Question
What do you want to know or explain? Use observations you have made to write a question that addresses the problem or topic you want to investigate.
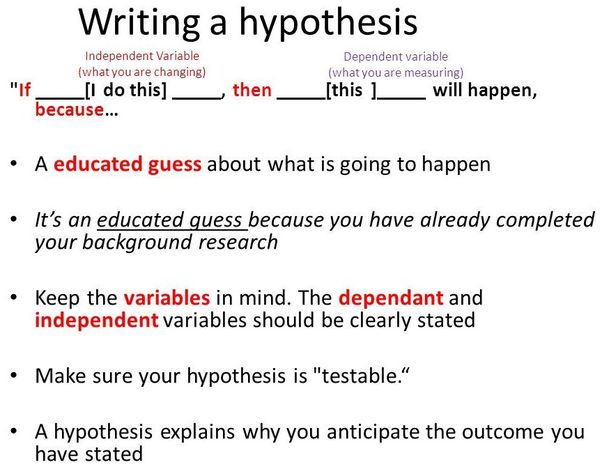
Formulate a Hypothesis
What do you think will happen? Predict the answer to your question or the outcome of the experiment.
Perform Experiment
Follow the steps in your procedure to perform your experiment. Record data and observations in a well constructed table.
What do you want to know or explain? Use observations you have made to write a question that addresses the problem or topic you want to investigate.
Formulate a Hypothesis
What do you think will happen? Predict the answer to your question or the outcome of the experiment.
Perform Experiment
Follow the steps in your procedure to perform your experiment. Record data and observations in a well constructed table.
|
Practice Writing a Hypothesis
|
Creating Data Tables
Understanding:
2.A1: All experimental design follows a detailed procedure so as they could be replicated by other scientists.
2.A1: All experimental design follows a detailed procedure so as they could be replicated by other scientists.
Objectives:
- Identify controls and constants of a given experiment.
- Identify independent and dependent variables of a given experiment.
- Write a brief conclusion based on experimental data analysis and background research

The Homer Scenario
Homer notices that his shower is covered in a strange green slime. His friend Barney tells him that coconut juice will get rid of the green slime. Homer decides to check this out by spraying half of the shower with coconut juice. He sprays the other half of the shower with water. After 3 days of "treatment" there is no change in the appearance of the green slime on either side of the shower.
Homer notices that his shower is covered in a strange green slime. His friend Barney tells him that coconut juice will get rid of the green slime. Homer decides to check this out by spraying half of the shower with coconut juice. He sprays the other half of the shower with water. After 3 days of "treatment" there is no change in the appearance of the green slime on either side of the shower.
|
QUESTIONS
1. What was the initial observation? 2. Identify the Control Group 3. Identify the Experimental Group 4. Identify the Independent Variable (what's being manipulated) 5. Identify the Dependent Variable (whats being measured) 6. Identify 3 Controlled Variables in the experiment 7. What should Homer's Conclusion be? |
ANSWERS
1. The green slime was growing in the shower 2. Shower half treated with water 3. Shower half treated with coconut juice 4. Solution used to clean the shower 5. Growth of slime 6. Amount of solution used to clean the shower, temperature of the solution, how long the solution is sprayed before wiping down the shower, etc. 7. Three days of treatment with coconut juice did not remove the green slime. More trials needed or more time of observation is needed. |
Understanding:
2.S2: Drawings of collected data organized into appropriate visual representations for further analysis.
2.S2: Drawings of collected data organized into appropriate visual representations for further analysis.
Objectives:
- Distinguish among the different types of graphs - bar, line, pie, etc.
- Set up and create a proper line/bar graph when given data including the following:
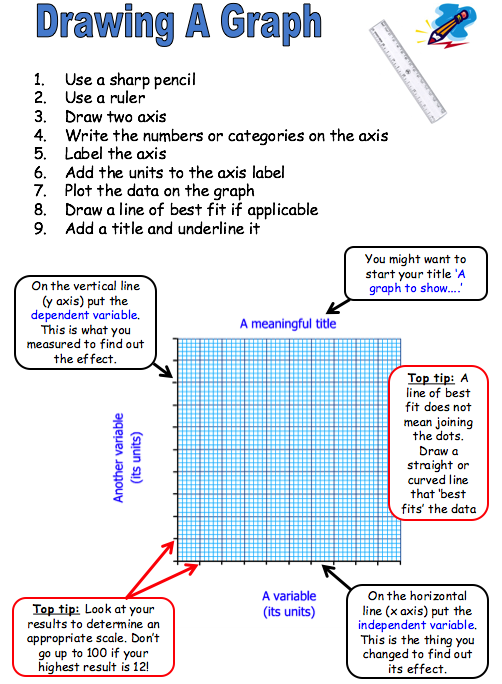
- Title
- X and Y axis labels
- Correct units
- Key (if necessary)
- Line graphs - used to compare changes over the same period of time for more than one group.
- Bar graphs - used to compare things between different groups or to track changes over time.
- Pie charts - used when you are trying to compare parts of a whole. They do not show changes over time.
Creating Scientific Graphs