|
Understanding:
10.2.U5: Chi-square tests are used to determine whether the difference between an observed and expected frequency distribution is statistically significant Objectives:
|
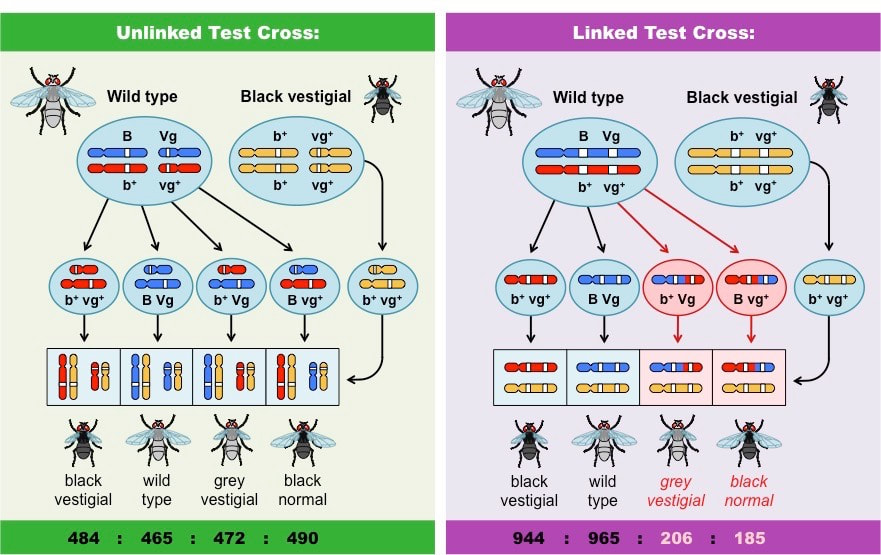
It is possible to infer whether two genes are linked or unlinked by looking at the frequency distribution of potential phenotypes
Offspring with unlinked genes have an equal possibility of inheriting any potential phenotypic combination
Offspring with linked genes will only express the phenotypic combinations present in either parent unless crossing over occurs
Offspring with unlinked genes have an equal possibility of inheriting any potential phenotypic combination
- This is due to the random segregation of alleles via independent assortment
Offspring with linked genes will only express the phenotypic combinations present in either parent unless crossing over occurs
- Consequently, the ‘unlinked’ recombinant phenotypes occur less frequently than the ‘linked’ parental phenotypes
Frequency Distribution of Unlinked and Linked Genes
Chi-Squared Tests
NON-GENETIC
NON-GENETIC
- Null Hypothesis
- Data is due to chance and is completely random. There is no significant difference between the groups/caregories.
- Alternative Hypothesis
- Data is NOT due to chance and there IS a significant difference between the groups/categories. Data is not random
- Null Hypothesis
- Data is due to chance and is random due to independent assortment being random. Punnet square ratios are expected.
- If there are two or more genes involved in the experiment, there is no fene linkage affecting the independent assortment and segregation. Punnet square ratios are expected.
- Data is due to chance and is random due to independent assortment being random. Punnet square ratios are expected.
- Alternative Hypothesis
- Data is due NOT to chance and is NOT random. Punnet square ratios are NOT expected.
- If there are two or more genes, there IS gene linkage affecting independent assortment & segregation.
- Data is due NOT to chance and is NOT random. Punnet square ratios are NOT expected.
Skill:
10.2.S3: Use of chi-squared test on data from dihybrid crosses
Objectives:
10.2.S3: Use of chi-squared test on data from dihybrid crosses
Objectives:
- Calculate a chi-square value to compare observed and expected results of a dihybrid genetic cross.
Using the df and critical chi-square value, determine if there is a significant difference between observed and expected results of a dihybrid cross
A chi-squared test can be applied to data generated from a dihybrid cross to determine if there is a statistical correlation between observed and expected frequencies
A chi-squared test can be completed by following five simple steps:
Example of Chi-Squared Test Application
The trait for smooth peas (R) is dominant over wrinkled peas (r) and yellow pea colour (Y) is dominant to green (y)
A dihybrid cross between two heterozygous pea plants is performed (RrYy × RrYy)
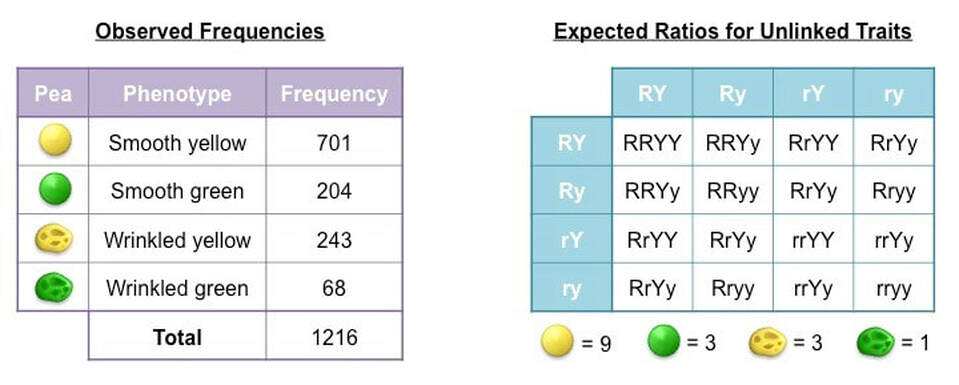
The following phenotypic frequencies are observed:
A chi-squared test can be completed by following five simple steps:
- Identify hypotheses (null versus alternative)
- Construct a table of frequencies (observed versus expected)
- Apply the chi-squared formula
- Determine the degree of freedom (df)
- Identify the p value (should be <0.05)
Example of Chi-Squared Test Application
The trait for smooth peas (R) is dominant over wrinkled peas (r) and yellow pea colour (Y) is dominant to green (y)
A dihybrid cross between two heterozygous pea plants is performed (RrYy × RrYy)
The following phenotypic frequencies are observed:
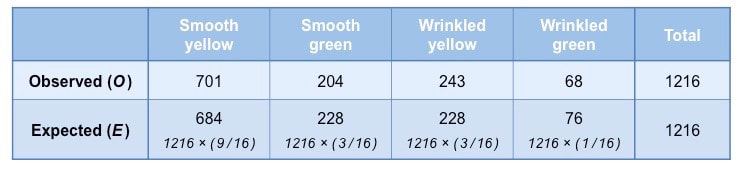
- 701 smooth yellow peas ; 204 smooth green peas ; 243 wrinkled yellow peas ; 68 wrinkled green peas
Step 1: Identify hypotheses
A chi-squared test seeks to distinguish between two distinct possibilities and hence requires two contrasting hypotheses:
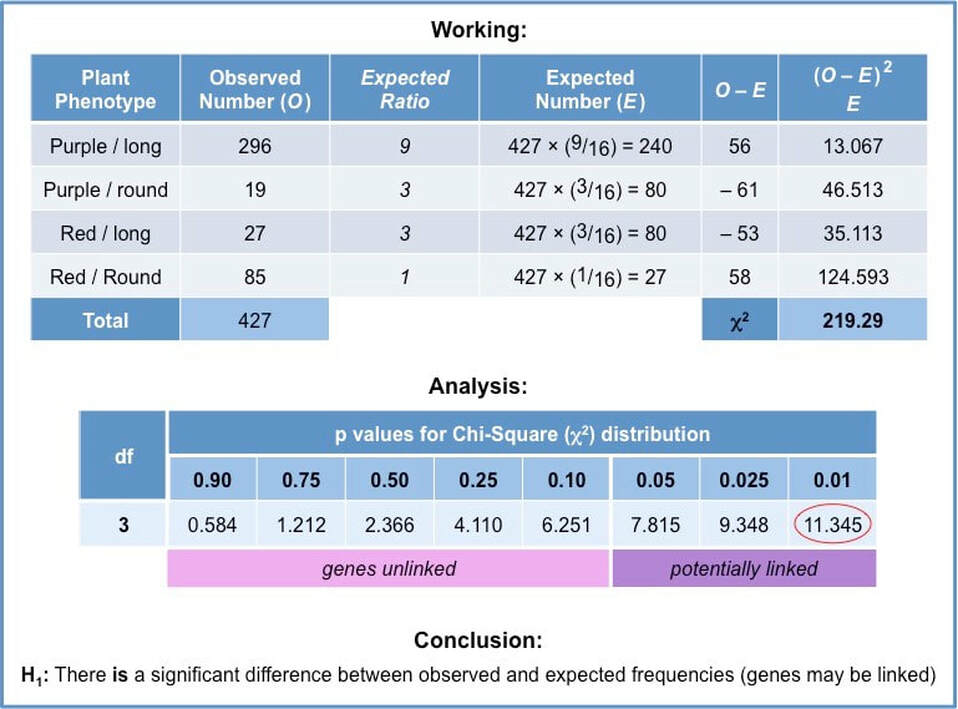
Step 2: Construct a table of frequencies
A table must be constructed that compares observed and expected frequencies for each possible phenotype
A chi-squared test seeks to distinguish between two distinct possibilities and hence requires two contrasting hypotheses:
- Null hypothesis (H0): There is no significant difference between observed and expected frequencies (i.e. genes are unlinked)
- Alternative hypothesis (H1): There is a significant difference between observed and expected frequencies (i.e. genes are linked)
Step 2: Construct a table of frequencies
A table must be constructed that compares observed and expected frequencies for each possible phenotype
- Expected frequencies are calculated by first determining the expected ratios and then multiplying against the observed total
Step 3: Apply the chi-squared formula
The formula used to calculate a statistical value for the chi-squared test is as follows:
The formula used to calculate a statistical value for the chi-squared test is as follows:
These calculations can be broken down for each phenotype and added to the table to make the final summation easie
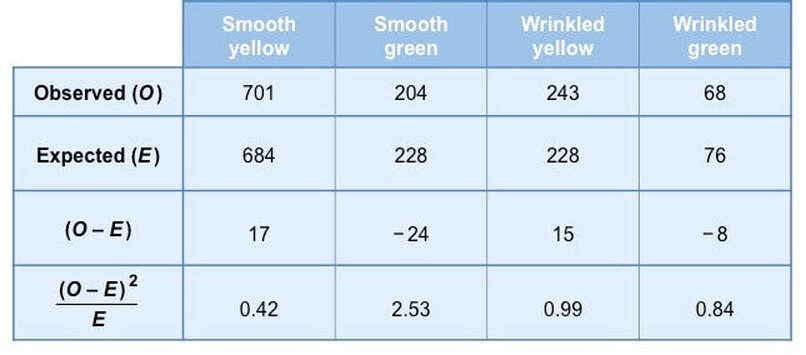
Based on these results the statistical value calculated by the chi-squared test is as follows:
Step 4: Determine the degree of freedom (df)
In order to determine if the chi-squared value is statistically significant a degree of freedom must first be identified
The degree of freedom is calculated from the table of frequencies according to the following formula:
df = (m – 1) (n – 1)
Where: m = number of rows ; n = number of columns
For all dihybrid crosses, the degree of freedom should be: (number of phenotypes – 1)
Step 5: Identify the p value
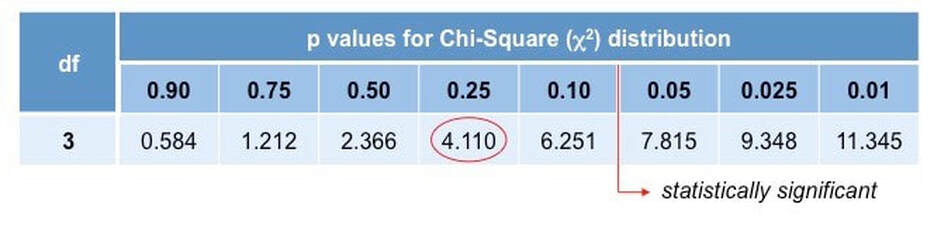
The final step is to apply the value generated to a chi-squared distribution table to determine if results are statistically significant
- 𝝌2 = (0.42 + 2.53 + 0.99 + 0.84) = 4.76
Step 4: Determine the degree of freedom (df)
In order to determine if the chi-squared value is statistically significant a degree of freedom must first be identified
- The degree of freedom is a mathematical restriction that designates what range of values fall within each significance level
The degree of freedom is calculated from the table of frequencies according to the following formula:
df = (m – 1) (n – 1)
Where: m = number of rows ; n = number of columns
For all dihybrid crosses, the degree of freedom should be: (number of phenotypes – 1)
- In this particular instance, the degree of freedom is 3
Step 5: Identify the p value
The final step is to apply the value generated to a chi-squared distribution table to determine if results are statistically significant
- A value is considered significant if there is less than a 5% probability (p < 0.05) the results are attributable to chance